Quantcast
Channel: Desert Home
Viewing all 218 articles
Browse latest View live

Tractor Hydraulics - Cylinders

$
0
0
I'm still waiting on my valve assembly, but I thought I would write a bit about repairing the cylinders on the tractor. The cylinders are what do the real work of lifting and moving things. The engine turns a hydraulic pump and that shoves high pressure oil down a series of tubes and hoses to extend or retract a rod. The rod is attached to whatever thing on the tractor you want to manipulate.


This is a picture of the tractor with red arrows pointing to the various cylinders visible on one side. These things are awesome; using the power of fluid at high pressure, they can manipulate the various parts around pivots to lift, dig, dump, etc.

They're also the thing that many people won't even attempt to fix themselves. While they will eagerly take on rebuilding an engine, they'll send a cylinder to the shop for someone else to disassemble and fix. This option could be justified if the rod is bent or something actually broke inside, but most of the time it can be repaired on a table in the garage using tools some of us already have, or can borrow. So far, I've rebuilt seven of these things and all of them work fine. No leaks.

First, let's talk about hydraulic shops. There are some really good ones out there that have excellent people doing great work, then there are the shops that I seem to find. There's one guy that is really good and a bunch that can't buckle their own belt. Guess which one usually deals with me? And, these places are expensive. A friend of mine had three cylinders done by Case; it cost him just a little less than $3000. This is under the price of replacement Case cylinders, so it was a better deal than buying new, but sheesh, that would make many folk abandon the tractor. What they did to me was say $300 to $400, but there may be problems, and that will raise the cost. Additionally, I have to take the cylinder off and get it to their shop.

So, they get the cylinder, take it apart and find a 'problem' that cost more than I can afford. I'm left with a cylinder that has most of the parts in a box, and a disabled tractor. No, I'll pull it apart and see what needs to be done. If it needs major work, I'll find a machine shop to do the work, or hunt for a replacement cylinder somewhere.

I'm not going to go into great detail describing how to work on one of these things, there's videos on youtube that cover it for the most part. Additionally, there's the perfect thread for someone attempting this for the first time over at tractorbynet.com <link>. Instead I'm going to tell you the things that you don't get from the videos and various web sites. There are just some things that they don't mention that I had to find out the hard way.

The single biggest complaint that folk have is that the cylinder leaks. It will leak inside, which causes the cylinder to change positions over time, and it can leak externally which also allows the cylinder to change position, but this time it gets hydraulic fluid all over the place. Both of these problems are fixed the same way, replace the various seals and o-rings in it and put it back in service.

If it's that simple, why don't more people do it themselves and save money? Some of these things are big, heavy, and all the fittings are stuck. You can't just grab a crescent wrench off the table and turn a couple of bolts to get them apart. And, to make it a little more complex, most of them require special wrenches. Here's the ones I had to buy to work on mine:


The two black ones, not the open end next to them.

It takes a LOT of force to open one of these cylinders, so a piece of pipe to use as a cheater bar is necessary to break some things loose. I used a three foot pipe that fits over the various wrenches I used. Let's take a look at what's inside one of these:


I know, it's a bit hard to see, but I wasn't thinking about posting it when I took this picture. Here's a parts diagram of one of my cylinders; they are all basically the same:


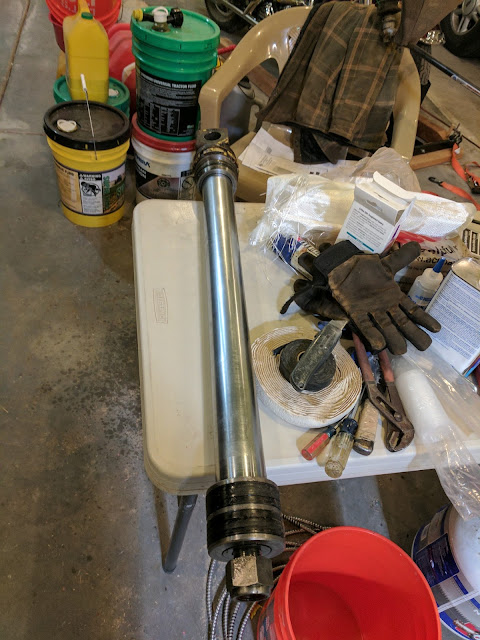
Part number 1 is the long silver rod in the picture above. 4 is the external oil seal. 6 - 8 are what's called the 'gland' and they go on the rod, but at the end near the rod mounting pin 3. 9-13 are the piston.

So, assembled the pieces look like the photo above. This is what you'll see when you finally get it out. But first you have to overcome the gland and external oil seal.

My tractor had two styles of glands. The one in the diagram above that is simply tapped into place and another that is threaded and you screw into place. Let's talk about disassembling the tap in one first.

It's really easy to put these things in, but not so when you try to take it out. First you have to unscrew the external oil seal. I talk about this process below. Then the press-in gland removal instructions I found said to drain the cylinder of fluid, then repeatedly tap the piston against the gland by shoving the rod in and then pulling it out, slamming it against the gland until it comes out of the cylinder. That didn't work at all. First, you simply can't get all the fluid out and each time you pull the rod, it hits the fluid inside and stops before hitting the gland. Also, the fluid sprays out one of the fittings and makes a mess.

How did I get it out? First, I unscrewed the external oil seal on the end before disconnecting the end nearest the bucket (more detail below). Then I set it up like this:


Yep, I pulled the Jeep in front of the tractor and hooked the wench up to it. This worked pretty well on all of them but one. That one was really stuck, and I actually pulled the jeep across the ground without getting the piston to come out. To make that sucker give up, I had to get inside the jeep and stand on the brakes so the front wheels weren't turning and run the wench. The two rear wheels weren't enough friction to make it happen. This is the gland, rod and piston from that cylinder:


There's two things that are important. The yellow and rust thing on the right is the external oil seal that holds stuff in, and it is hard to get loose. I used the wrench shown above and a three foot cheater pipe, and still had to hit it with a two pound hammer a couple of times to get it free. Some people use a pipe wrench, and that will work too, but it's really hard to keep the pipe wrench on while applying pressure. You have to get a neighbor to hold the pipe wrench in place while you stand on it and jump up and down. No, a longer wrench won't help; it's just harder to control. If you go the pipe wrench path, be careful not to crush the oil seal. This bugger is easier to break than you might think having just pounded on it with a hammer, but read on.

The other thing is the silver nut on the left. These things are put on with several hundred pounds of torque and are over an inch across. I used an 18 inch crescent wrench with the cheater pipe to free it. But, how did I hold it in place while applying that much pressure? That was easy, just put the rod back on the tractor but not in the cylinder. Then, using the entire tractor as your vise, go for it using the cheater bar to break it loose.

Be careful if you decide to use heat on this nut. It's one of these:


It would be really easy to melt the material inside the nut that helps keep it in place during use, and these nuts are expensive.

That brings up the question of how to torque this thing back on. What I did was to use the cheater bar and crank it down as tight as I could after putting a couple of  SMALL spots of RED Loctite on the threads. They've held well for quite a while now. Same thing with the external oil seal, but don't use a cheater bar on this. Just put the spots of Loctite on the threads then snug it down tight using a wrench. I'll tell you why not to use a cheater bar on it below. Lots of folk will disagree with me on the red Loctite because it's meant to be permanent. You normally have to heat it up to around 400F to get it to let go. However, with the invention of impact drivers and wrenches, mechanics found out that sharp impacts will fracture the bond and let you remove it. Since you'll probably have to hit it with a hammer anyway, that should be enough. Also, nitromethane solvent will soften the Loctite, but that might take several hours. Yes, I had to go through this process and I'll write about that below.

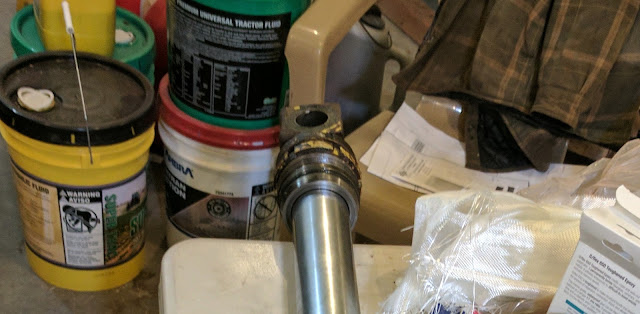
Now for the other kind of cylinder assembly where the gland is screwed in. These are usually larger cylinders that are much heavier and will take some leverage to move around. Sorry, I don't have a good picture of this, the camera wouldn't focus well enough. Here's the rod, gland and piston from one of those cylinders.


Here's what the outside end of it looks like:


The end is actually two pieces; one that screws directly into the cylinder and the other that screws into the first piece. The external oil seal is the bottom piece, it has a seal in the end to keep dust collected on the rod from getting inside as well as a couple of o-rings inside to hold back whatever oil may get to it. The upper one is the actual gland and has packing inside that the oil seal helps keep in place. Both of them are hard to remove, but the external seal is the easiest. The gland was really hard. If you look closely you'll see burn marks where I heated it up to get it loose. I took an acetylene torch and ran it around the outside until I was able to turn it with a wrench and the cheater bar.

The end nut that holds the piston together was not as hard as I expected, I only needed the cheater bar to get it to move.

The reassembly after replacing all the o-rings and seals was pretty easy, but I managed to mess it up. When I put the external seal in place I over-tightened it and broke it:


This was the first cylinder I rebuilt, so I have something of an excuse. I thought that since it was so hard to get off that it should be torqued down and it just crumbled.

Turns out that these are often made from cast iron, not steel. The cast iron just couldn't handle it. Man, was it hard to remove. It was as tight as it could be and had red locktite on it. When I went to replace it I used a chisel and pounded it pretty hard for a while; it finally gave up and turned a little bit. I got a replacement for just a shade under $100. Total rip off, but I couldn't find a used one anywhere.

Now, let's consider the replacement seals. If you go to a dealer, they'll sell you a kit that has the necessary seals and such in it to replace everything. I actually found seal kits for this tractor, but ... $200 for some o-rings?? There had to be a better way. Calling around the various places that serviced hydraulic systems was worthless, they all wanted to sell me the expensive kits or do the job for me. I finally talked to a guy that suggested going to a store that specialized in this kind of thing. I got a hint from the parts guy at a local AutoZone, Martin Fluid Power.

I found Martin Fluid Power on the web and they had a store in town, so I loaded up the first cylinder and went there prepared to show them exactly what I needed. They were great. The guy measured each spot where a seal was supposed to go and gathered up the parts right there in front of me. I took my bag of stuff that cost $25 and went home with it. I just saved myself $175 a cylinder.

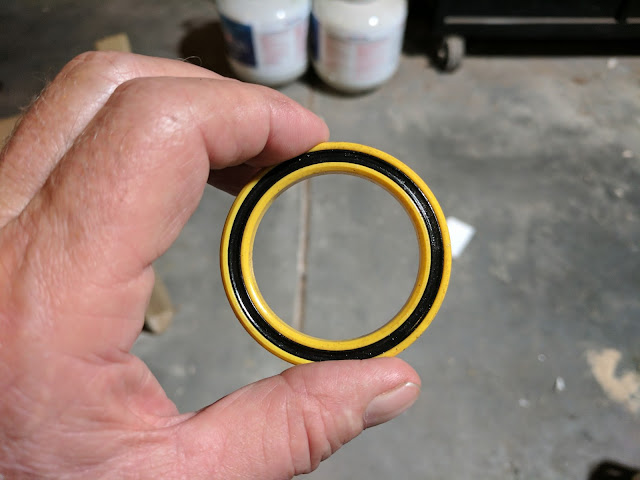
What was there originally for packing was called a Vee Pack. This is a specially shaped seal that you combine a number of to fill the space. The orientation of these is important. There are two kinds of basic cylinders: single action and double action. Single action only push one way, they are returned by springs or the weight of what they are moving. Common examples are a floor jacks or the jacks under motor homes. Double action get fluid pressure on both ends to move it in or out. Most cylinders on tractors are double action. The only exception I know of are the swing cylinders on some backhoes, they use two single action cylinder in opposition to swing that big boom around. The Vee Packs are arranged differently in the two types. Here's a picture of mine to supplement the ones in the thread I recommended up top:


See the shape? If you were to cross-section them they would look like a 'V', hence the name Vee Pack. You basically point the open side toward the fluid pressure so they expand a tiny bit and hold back the fluid. What makes it a 'pack' is that it consists of several of these with a special spacer in the middle; some of them point one way and the rest point the other. Out there on the web are some illustrations of this and how they hold back the fluid and move the piston back and forth in the cylinder.

Naturally, being me, I didn't replace them with a normal Vee Pack. I used what they called a Poly Pack. These are high tech materials that work the same way, but survive much much longer. You almost never see Poly Packs on tractors, but for a tiny bit more money, they should last until the tractor wears me out. They look like this:


They have the same action of expanding one edge a tiny bit under pressure to fully seal the cylinder, but the different shape and extra spacer piece in the middle work to decrease friction and wear. The material also helps with friction and keeps the temperature down during use. They work the same, buy enough of them that fit the particular cylinder and fill the space; put half of them facing one way and the other half facing the other. When you lay them out remember the wide end faces the incoming fluid.

I used these on the pistons as well as the interior of the external oil seals. They just work with no hassle at all. Getting the right size may be a tiny hassle, but a good parts man can help with that.

Lastly, a couple of suggestions for doing this. Take a LOT of pictures; this isn't the good old days when you had to have film developed. I didn't take enough, and when I put back one of the cylinders, I messed it up. Here's a picture of the installation showing the hydraulic hose:


Don't see the problem? Let's look a little closer:


Most of you see the problem, but for the ones that haven't messed with a tractor, the answer is, I got the cylinder in upside down. When the cylinder pivots up it will crush the connector. Guess what:


It did. If I had taken a before picture and then actually looked at it, I would not have had to order a new hose. That brings up another point hydraulic hoses.

Hydraulic hoses cost way too much. Well, that is if you go to the places that various folk recommend. There's a place here in Phoenix that everyone touts as being THE place to go for hydraulic hoses. I went there for the first couple of hoses and paid out the nose for them. The next set I went to AutoZone and got them. Frankly, if you don't live in a farming community, AutoZone is a pain because they don't understand pressure and flow well enough to put the hoses together. I talked the parts guy through it and got what I needed, but there's an even better way: go online. There's several places that sell hydraulic hoses online that have great customer service. You call them up describe what you need, maybe send them a picture or two, and they will put together exactly what you need. And, the price is fair.

I don't know if you noticed or not, every single place that I went to wanted to charge me several times what the stuff was actually worth. I fully expect to pay retail, but two hundred dollar seals, undefined labor rates that are under their control, triple the price hoses (or more) just isn't what I want to do. Look online for the stuff, the wait of a few days may save you hundreds of dollars and make an impossible project possible.

And,

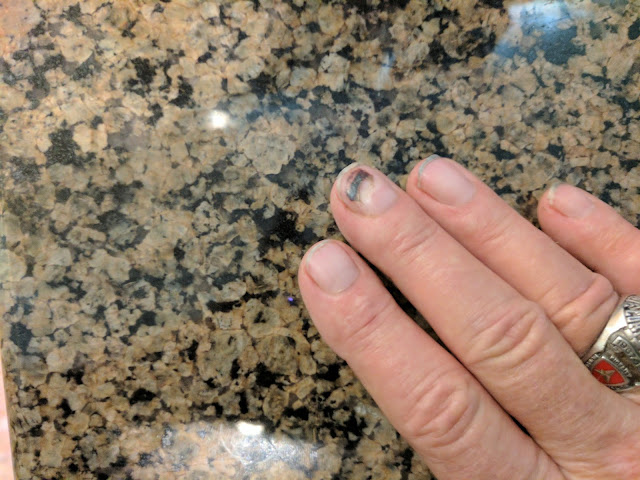
When you pry the various things apart and scrape the crud out of the various grooves, be careful with the darn screwdriver:


The rods are heavy and covered with a film of hydraulic fluid. When you handle them, wear gloves that increase the friction between your hands and the rods. This will offer some protection and lessen the chance of dropping it on something soft:


Have fun.

Room Temperature Sensor; got to use the 3D printer for real

$
0
0
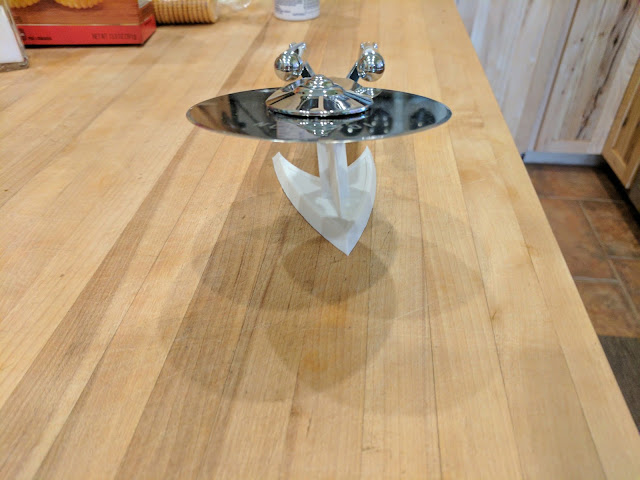
I used my 3D printer on a real project, the room temperature sensor. I spent a ton of time messing around with various drawing tools and learning a little about slicing software, but didn't actually do anything that could be considered useful. Unless you count a stand for my Star Trek Enterprise that I have on the kitchen window sill:


I got the files for the stand off Thingiverse <link> and just printed it. Thingiverse is wonderful for getting things that other people have worked on, but it isn't the same as coming up with your own idea and stepping through the entire process.

I decided on the basics of an enclosure for the sensor weeks ago, but it took a while to decide on a tool to use to design it, then the actual design process. I tested a couple of enclosure ideas for a few weeks and finally, a couple of days ago, put four more of the sensor electronics together and printed enclosures for all of them. I have five areas of the house being monitored and recorded in my home database that I can chart and examine.


Yes, they follow each other really well over the period charted, but remember, a temperature change of a small amount will make a room feel hot. It's interesting to watch this phenomenon. One room is 75F and the next is 78F, not enough to matter, but it feels really hot in the warmer room. It doesn't help much to put a thermometer in the warmer room so you can see the actual temperature; you just think the thermometer is wrong. Strange.

Here's what the entire assembly looks like on the wall:


It consists of a base plate that you mount to the wall and a cover that slides over the base to protect the wiring. Here's the two pieces before mounting:


Most of the engineers out there could have drawn this up in about 10 minutes, but frankly, this process was tough. Every little item had to be measured and thought out carefully. I had many, many test prints of sections to see if various things actually fit together. I kept running into little unexpected problems. The plastic would be a little too rough in some spots and pieces wouldn't fit together. The model would glue itself to the base of the printer and it flatly refused to come off. I didn't put holes in the sensor PC board and had to come up with a mounting solution for it. How tall EXACTLY should a stand off be for the various pieces?

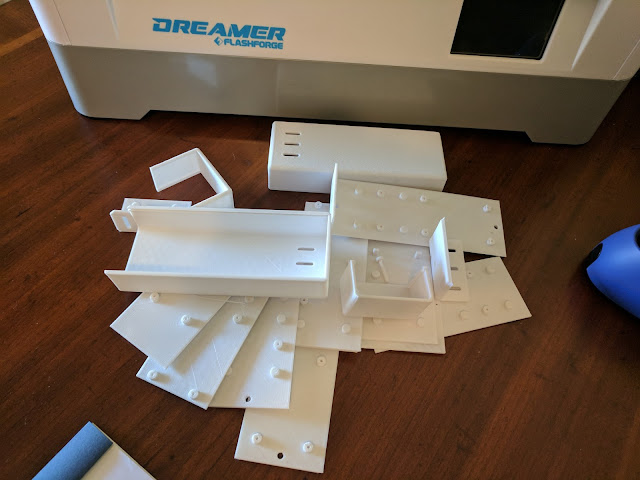
Most of this stuff was trial and error. Lots of errors. Just look at the pile of various attempts that will go in the trash after I post this:


One thing I discovered towards the end of the project was that I could cut the model and only print part of it. That was a real time saver. I could print the section I was trying to settle on and test it without waiting hours for the printer to finish the entire thing. I didn't read about using this capability anywhere on the web. Lots of folk talked about cutting the model, but didn't mention how it could be used to test a section of it. I guess most folk use 3D printers to make single piece items.

It's surprising how many little things creep up and have to be solved. The battery holder:

was initially a bit of a problem. I didn't want to mount it flat to the base plate because the mounting screws would go through the plastic, so I put in a couple of standoffs for the two screws that go through the holes in the middle of the assembly. Of course, that made it rock on the screws when I messed with the batteries. I solved that by putting in four more standoffs that kept it from moving.

Th circuit board with the electronics on it didn't have holes for mounting screws (oops).


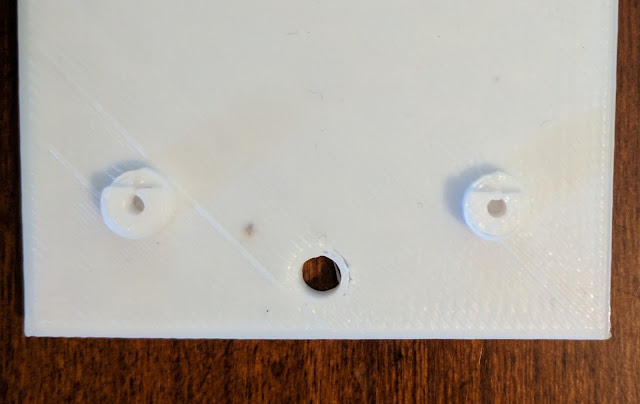
So I had to work out special standoffs that could hold the board in place. Of course I didn't have washers that would fit the standoffs, so I just printed them as part of the base. Here's what the base wound up looking like after I solved these problems:


The battery holder has six standoffs two of them for actual mounting and the others to keep it steady. The standoffs for the PC board have a cutout for the board and I use little washers to hold it down securely:


The little dark spot in the center-left is a moth that was attracted to the heat and became part of one of the sensors. Note to self: close the printer door stupid.

I slid the lid up on one of the sensors so I could show off the construction of the assemblies:


If you zoom in on the picture you'll be able to seee the mounting arrangement more closely. They were simple to install since they only take two #6 drywall screws and the entire device doesn't weigh much.

This project has been a lot of fun over the last couple of years. Yes, YEARS. And it isn't finished yet. I still want to use the sensors to replace the two house thermostats by taking the readings of each room and turning on heat, cool, or just fans to control the internal environment. I want to chart the outside temperature along with the rooms to see how it affects things as the day passes from season to season (notice, I only have two seasons here: nice and too-darn-hot). I may even create outdoor sensors to measure the wall temperature on some of the outside walls. That will prove the insulation effectiveness.

Who knows what I'll do with this in the future.


Xively: See I told you so...

$
0
0
Over and over again I've ranted about how I hate cloud storage of data, or reliance on cloud services for control around the house, and again I was justified. Earlier this month Xively (formerly Cosm (formally Pachube)) turned off free access. Never mind that years ago Pachube promised access forever for its early users and promised again when they became Cosm. Xively didn't honor the promise.

So much for promises. Remember the wonderful free service DynDNS that had its software installed on new routers? That went away a while ago and I had to change away from that service, now I get to stop the update process for Xively and pull the data from my local database instead.

At least I'm ready to do the switch, and I wish I had bothered to do it a year ago, but I was lazy. Teach me...

They were pretty nasty about it too. They sent emails to some fraction of their free users, and ignored the rest. Even the users that got the mail only got about two weeks notice and were unable to suck the data off the cloud service in time. The others (like me) found out from friends or just noticed one day that the service (and all their accumulated data) had disappeared from the site.

They couldn't even log in, and mails seemed to disappear into the same black hole as their data.

I don't recommend any product from LogMeIn. For software to avoid, see the Wiki page on the company and avoid all their offerings. The nasty way they did this should be a nice hint for folk.

I'm not going to recommend a replacement because this situation is only going to get worse over time. Hold your own data at someplace that belongs to you, not some profit driven jerks.

Now, where was that charting software I like.

Grafana: So, how well does this thing work?

$
0
0
As it turns out, pretty darn well. For those of you just getting into house control and monitoring, Grafana is a general purpose set of graphing tools. However, its documentation is daunting. They start right off using terms I never heard of and I couldn't tell what I needed to do. So, in typical Dave form, I downloaded it and started playing around.

I actually followed the steps they suggested and had my first graph running in about an hour. Never mind that the data was mixed up and in the wrong order, I actually had a graph I could look at.

Unlike most folk that delve into this tool, I'm using MySQL as a database manager to store my data. Most folk use a time-value series that is faster and smaller than a full blown database manager. But, I started with sqlite and moved to MySQL because I wanted the flexibility that was available. Of course that meant I had to create queries to the data base for gathering data, but they gave me examples to modify and it was somewhat easier.

Once I got the hang of the basics, I added my room temperature sensors as a 'panel' inside a 'dashboard'. This was cool, I could isolate sections of the graph for examination and change the span of time displayed just by clicking. Then I added the chart I look at a lot: outside temperature vs power usage. This is the key chart I use to keep power usage down to a reasonable amount.

I had about five hours into this by now, so I just let it run, updating every minute overnight. It worked fine. First thing when I looked at it, it showed the temperature drop for the night and when the heater kicked on. Nice.

Now, the problem is that I have to make it work for real. By that I mean that I want to be able to get to it from any device I happen to be using. I use a tablet a lot for this kind of thing and occasionally my phone. Haven't made that stuff work yet.

My plan is to install the software on a Raspberry Pi and allow it to be seen outside the house. That means I have to worry about security since there are SQL queries in there that can be messed with. I'm not much worried about someone watching my data to see if I'm home, I live in the middle of nowhere down a dirt road, so getting here is beyond the effort most thieves are willing to invest. Plus, if they make a mistake and I'm home ... shotgun practice!

Since I installed it on my laptop for convenience, I get to start all over again, so I don't want to develop it too much further before getting it set up for real use.

Oh, I also remembered why I haven't looked deeply into this earlier. They only enabled it for use with MySQL last year. Every time I looked before, it wouldn't do the job for me. MySQL seems to work fine now.

Here's a screenshot of the very first panel I made:


Like I said, this took a about five hours to get going, but that included installing it and figuring out how to connect it to my data base. Quite a bit of time was spent playing with colors and text as well, so your mileage may vary.

Nice tool if I can make it work outside the house on a phone. We'll see.

Grafana: Now to get it working on a Raspberry Pi

$
0
0
Last post I talked about how I got Grafana working on my desktop talking to my database. It actually worked pretty well. Unfortunately, the laptop is NOT where I want it to run; I want it to be running on one of my Raspberry Pi machines. Since I have one of the Pi 3b's and, it isn't doing much of anything, I put it there.

Like almost everything related to linux, this was a pain. It seems that since I last played with that little machine, there have been two major updates to the OS. They went from Jessie to Pixel to Stretch. WTF?? Are the folks at Raspberry Pi running out of things to do?

Fine, I downloaded the minimal image of Stretch and wrote it onto an SD card, made a couple of changes to the boot init files to run headless and booted it up. That worked first try. They really did make some improvements in that area. No gritting your teeth and closing your eyes before rebooting; it just worked. Then I went looking for a Raspberry Pi version of Grafana ... Guess what? Grafana doesn't make one !  Fortunately, there's a person out there that took this job on for the rest of us. The github user 'fg2it' has created a github repository that holds Grafana for the various versions of Pi OS's and it's relatively easy to use them --- after you figure out what the heck he is doing. The repository he created is here <link>, and in the instructions he does a cool trick of updating where Grafana is installed from, then used apt-get to install it. I stumbled over that for a while before I got it working. Really, really clever way to do it.

Aside: I ran into instruction after instruction for installing Grafana on the Pi, and almost all of them referenced back to fg2it's repository but, tried to take the credit for all the work. The slimeballs only referenced fg2it in the various commands. You'll see what I mean when you go looking around. Thank you fg2it.

I installed the 'Stretch' version of Grafana on the Pi I had just updated and made the simple changes necessary and it worked. I could log into Grafana and create charts that I copied from the laptop version I had used previously. Everything worked pretty well. Next, I added some more charts and explored a bit. Here's the way it looks right this minute when I load the graphs up on my laptop:


This is produced by Grafana running on a Raspberry Pi displaying on a Windows laptop and getting stored data from a MySQL database running on a QNAP network appliance. Cool !

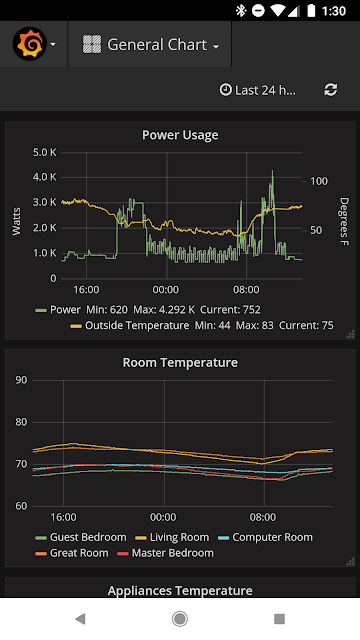
Yes, since it's only a web page, it works on a phone as well:

You do have to scroll down on the screen to see all four of the charts, but that's the way it should work on a small device.

There's a ton of features I haven't played with yet, and I'll get to some of those over the next few days, but first I want to protect my database and figure out some way of offering this up on the web. It may get complicated since this machine can't be seen from out there.

Also, this machine only has an SD card on it. I had to leave the usb solid state drive out of the installation to get this much running. That will have to change since I've never had good luck with the SD cards. Three - four months and they crap out leaving you with a days work getting it running again.

Note that I have no dependency on any cloud service at all. It's my database, and all the software runs right here in the house.

Take that Xively !

My Freezer: Right in the middle of installing Grafana

$
0
0
So, I'm installing Grafana on my laptop and pull up a chart that looks like this for my monitored appliances:


What the heck? the freezer in the house is getting hot! About a minute later, an email comes in that I actually check since I'm setting right there and it tells me that the house freezer is over 50 F.

Yes, my freezer sends me email. I set this up about 4 months ago when the door didn't get closed completely and was open for HOURS before I noticed it. It didn't cost me much to replace the stuff that had thawed out, I cooked it instead, but having it happen got me to thinking about alarming that kind of thing. I have a process called 'healthcheck.py' that I run as a daemon (all the time) that monitors the other processes and many of the devices that are reporting around the house. Things like the XBee coordinator process, the thermostats and the septic tank float are watched for problems and an email is sent every hour that they don't perform up to snuff. I just added code to this process to watch the temperature in the appliances to make sure they were OK.

I got up, walked over to the freezer, put the frozen french fries back on the shelf correctly, and closed the door. Problem solved and crises averted. All the scoffers out there that poo-poo'd me about putting a temperature sensor in the appliances ... No, none of the other folk that are automating and monitoring their houses had disparaging comments, it was neighbors and friends that just let the house react to things and then complain wondered why I bothered with that much work.

Really ?

What was really unexpected though was the aftermath of letting the freezer warm up like that. Take a look at this chart of the aftermath:


I suppressed the other appliances and expanded this to show a little normal operation on both sides. The big deal is how long it took for the freezer to return to normal. Because I left the door open for about two and a half hours the temperature went all the way from below zero up to 63 degrees. Then it took over 24 hours for the thing to get back to normal.

Wow, I gotta pay more attention to that door. What the heck was happening with the power usage during this time?


Here's the power chart for the same period, and I see that shortly after I closed the door the freezer went into a defrost cycle. That's a good thing because there had to be a bunch of ice all over the evaporator coil. The compressor was on trying cool a freezer with an open door and humidity from the house was freezing all over the coil lowering its efficiency. Then the ice maker took off to fill the empty ice bucket that I had emptied of sludge. The compressor ran for the entire 24 hour period getting the internal temperature back down where it should be, but the defrost cycles and ice maker ate some of the energy during this time.

So, the power bill will be a little higher this month, but notice that the freezer only uses around 150 watts. It won't cost me much at all. Once I started watching the appliances, it really impressed me how little power they use. A little Honda generator could power the appliances around my house for an extended power failure. That will almost certainly become a project in the future.

There's a couple of other things I want to point out to readers. First, the reason I left the door open was that I was playing with Grafana and got distracted. Second, the graph I was playing with actually told me something useful: the stupid freezer was getting hot. Third, I was immediately able to research the results of my screw up. What went on with the temperature recovery in the freezer and how that affected my power usage.

That is so stinkin' COOL. (pun intended)

So, I really recommend saving data for some period. I've never gone back more than a few months looking for some change or problem, but as shown here, a couple of weeks can really be valuable. I personally carry years of data, but that doesn't mean I have to; it also slows down my database queries. So, balance your own needs to what you want to do. Over time, you'll work it out.

Also, Grafana allowed me to look at different time frames and data really quickly. It took me just a few minutes to prowl through the data to understand what was going on. I could have done the exact same thing with other charting tools I've tried, but it would have taken me way longer. Man I'm glad they implemented MySQL in this tool.

I probably should go clean the freezer now, but at least it's working.

Grafana: Getting close to having something nice

$
0
0
I spent a few hours getting a Pi 3B running properly for this Grafana project. I actually think it is going to worth the effort. Grafana seems to work well and I have all the code on my own machine.

What I had to do was first set up a usb drive for the machine so I didn't depend on a silly SD card. I went into this with my teeth clamped down because previously it had been a pain to implement <link>. This time, it was a piece of cake.

What the folk did at Raspberry Pi was take the idea of a usb drive seriously. You enable a bit in the configuration, read the SD card you already have running into a file, write it out to the usb drive, plug it in and boot the Pi. OK, it's a little bit more than that, but not much.

I followed the instructions for setting the bit that allows boot from usb drive in the instructions on the Pi site <link> and found out the bit was already set. Then I remembered doing it when I was experimenting before. Then I took out the SD card, stuck it in my laptop and copied an image to a file. Next, I plugged in the usb ssd I already had from last time and copied the image over to it.

I walked across the room and plugged the usb drive into the PI, plugged in the power and went back to the laptop. Putty connected to the Pi on the first try. Notice I didn't say anything about plugging in an SD card?

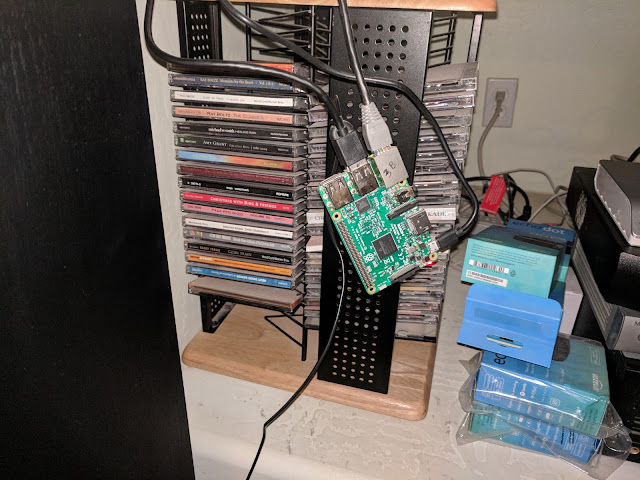
Nope, the machine is running just fine without an SD card at all. You do realize that this makes the Pi into a full blown computer that you can actually rely on! Yep, this may justify making an enclosure for the combination so it looks pretty on the shelf. Right now it looks a little forlorn over there:


Looks a little strange hanging by its wires doesn't it? Notice the unopened Echo Dot boxes right by it? That's for another project I hope to get to some day.

I created a special user in the database that can only read data from certain tables to protect against the scary "SQL injection" attacks by hackers so my database is OK. I forwarded a port to the machine from my router so it can be seen from outside when I finally trust it enough to do so; I may be ready to show this thing off in a few days.

Then I spent a little time adding a few new items to the Grafana dashboard so I had more things I could check on just by glancing at the display. It looks like this right now:


I have the appliance power usage and battery level of the room temperature sensors charted so I can follow them over time. There's other things I can chart for fun and some other indicators that would be nice to see from time to time, but I think I'll use this arrangement for a while to see how it feels.

This entire project has been a success. I gues it was time for my readers to nudge me again about using some of the public tools. Remember this all started when I wrote about Xively a little while ago <link>. Maybe I'll look at Home Assistant next.

Or maybe I'll just make cool charts for a week or two.

Local Power Politics

$
0
0
I live in Arizona USA just north of Phoenix in the foothills. Power here is supplied by a company that calls itself "Arizona Public Service," that is an owned subsidiary of Pinnacle West Capital Corporation. I'm bringing this up because they've managed to get two rate increases in the last 12 months. This is actually not that unusual in this country, power companies are considered a "public utility" and given a service area in which they are a monopoly. Since they are a monopoly, they are heavily regulated and watched by some political entity; in the case of Arizona, it's the Arizona Corporation Commission. Additionally, the commission is responsible for making sure the utilities they oversee make a reasonable profit.

What an incredibly wonderful position to be in. To have a public commission that will guarantee you a profit no matter how bad a business you run. That MUST be worth a few regulations that may be somewhat annoying. I bet it also accounts for some of the high salaries they report...

Boring right? You probably clicked off the site about the middle of the first paragraph; I don't blame you.

The reason this is important to me is illustrated by the following screen shot of a rate calculator APS (the aforementioned jerk company Arizona Public Service) put on their web site:


Zoom in if you have trouble reading it.

This is a comparison of two of their rate plans compared with the plan I currently have. Notice the "difference" column for the two new rate plans, "premier choice large" and "saver choice max" and how much the difference is between the money I'm paying now and the money they project I will pay in the future. No, that isn't a typo and I didn't take photoshop to the screenshot, I'm projected to see an increase in over $1700 for a years worth of power.

Kinda makes you wonder why such a thing got past the regulating committee AZCC (Arizona Corporate Commission) doesn't it? Of course it couldn't be because all but one of the Commissioner's campaigns was heavily financed by APS could it? Of course not; we have the best commission money can buy.

Like most of this country our power bills are cluttered with a ton of little charges to disguise what is actually being charged. There is a charge for renting the meter we're required to have, a charge for reading the meter, a charge if we don't have a 'smart' meter which is read remotely, a charge for billing us, a charge for preparing the bill, ... you get the idea. As a matter of fact, my well power bill is literally half these charges and the other half is actual power used. (Yes, I can prove it.) I'm still wondering why I pay to rent a smart meter that is read remotely and being charged for reading it. Something there doesn't make much sense.

Leaving the whining aside, what the heck is with an increase of over $1700 a year? When they presented the rate plans they predicted a 4.5% increase that should average out to around $6 a month. This is the kind of thing they managed to push through the AZCC. It took them over a year of hearings and testimony to get the increase, and part of the settlement was the rate calculator they created. The calculator was designed so people could make an informed decision which plan they would go with in the future since APS is removing all the other plans people have had for years and years.

Well, after a few phone calls where I had to convince the APS representative that I was right, I finally figured out what the heck was going on. The calculator is pure crap. The calculator takes into account the actual time usage of the home and applies it to the new rates. Since I control my power and keep my peak usage way down, the calculator goes nuts.
That probably means that my bill will be considerably less than they predict, but it also means the calculator thousands of people use to make an informed decision is wrong. Nice job folks.

It also means that thousands of bills will be calculated by the same computers and the same software written by the same programmers that came up with this mess.

Yes, I filed a complaint with the AZCC and wrote letters to both of my state representatives about this very thing. Never had much luck with either of those, but

Wish me luck.


Tractor Hydraulics: New Front Loader

$
0
0
A while back I posted about the front loader valve on my big tractor, then forgot to post an update <link>. Well, after several screw ups and two separate orders for new hoses and such, I got it installed on the tractor.


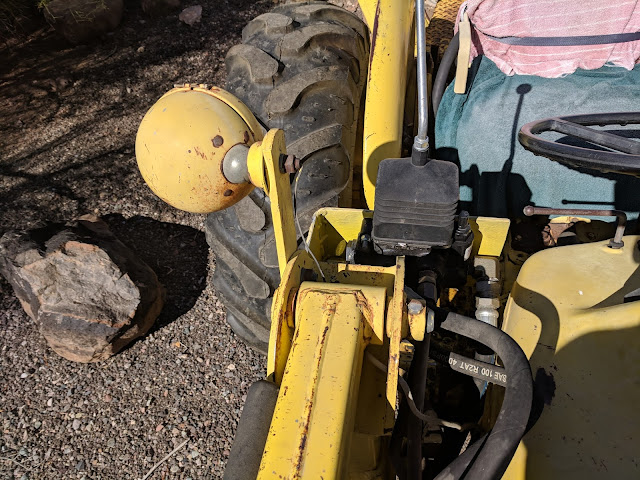
Looks good doesn't it?  I had to cut off the old mounting arrangement entirely since there wasn't enough room for the new valve in the existing one. Then I had to get some 1/4 inch plate steel and bend it to wrap around as shown above. This gave me a place to mount the valve itself. Here's the old mounting arrangement:


Compared with the new:


That was an interesting project in itself; mainly because I'm not a welder, I just make stabs at it from time to time. That mounting plate was cut with a plasma cutter and then I bent it by cutting some lines about half way through the plate and bending it over in a vise. I stitch welded the cuts to make them hold. The entire plate was welded on the side of the front loader pillar so it would be in approximately the same place as the old one.


The old valve was plumbed with steel tubing and some of them wouldn't fit the new valve, so I got some hydraulic hoses from an on-line vendor and connected it that way.


My return line is the one on the bottom; that leads to a new fitting I put on the fluid tank.


You can just barely see the fitting under the mount on the side of the pillar. On this tractor they used the frame of the loader as the reserve fluid tank, so I couldn't drill any holes for bolts and such. It all had to be welded. Here's a better view of the return line:


That was another new experience, welding with a MIG loaded with flux core wire in the desert winds. Try fitting your head in there with a welding helmet around it. I have a couple of new scars to brag about.

After fixing a couple of leaks and crossing my fingers, it worked first try. I used the tractor to move some stuff around and the new valve was great. I probably have the only 3000 series Ford tractor with a joystick. Other folk have thought about it, but I haven't read about anyone actually doing it.

Aren't tractors fun?


So, I Went to a Couple of Garage Sales ...

$
0
0
Driving down the road this fine Saturday in the desert I saw a sign for a garage sale. I don't normally go to these because I haven't had much luck finding anything of interest, but a couple of weeks ago I stumbled on a really cool clock (more below) and thought, "what the heck?"

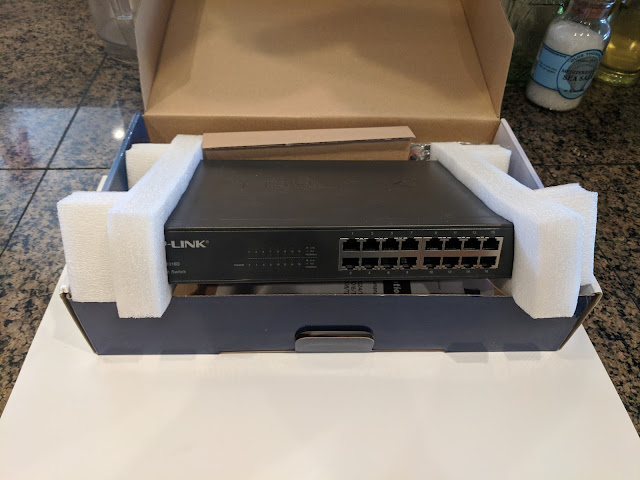
Sitting on a table being ignored by the other customers looking for the perfect piece of glassware, child's clothing, big crescent wrench or first printing Gutenberg Bible was a 16 port gigabit TP-Link Ethernet switch. Trying to hide my excitement I asked the owner, "How much?"  "How about five bucks?"

Here it is:


Brand new, in the box, ready to go on the shelf where all the little computers are.

I've been thinking about getting one to support all the little computers that seem to be breeding over there. Right now I'm down to the last port on the switch that handles them and the next one would require this or something like it. Five Bucks?! This particular one is $76 on Amazon right now. Score!

I like to have anything I can connected hardwire into the house ethernet because I don't have to worry about how far away the nearest wireless access point is. This addition to the 'little computer shelf' will help out a lot.

No, I didn't ask them where they got it ...

The clock I mentioned above was an impulse purchase I made a couple of weeks ago at an estate sale. Estate sales are sad (at least to me) because someone passed away and a company is liquidating their belongings. I always get a little stuffed up when I wander through them thinking about the pleasure the items gave their owner, and I usually pick something out that probably had some meaning to them so I can help a little bit in keeping a tiny piece of history around. OK, it doesn't fit may image, and I'll never say that out loud.

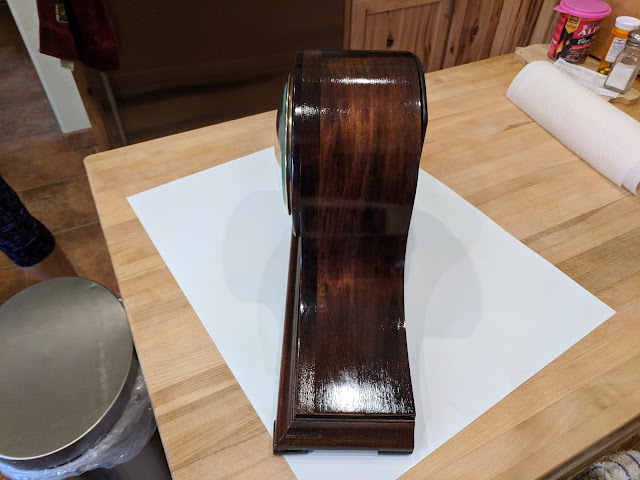
I saw this mantle clock that had had a hard time of it, the poor thing was stuffed on a shelf and was brush painted white. Sad little fellow kind of whimpered, "Take me home." So I did:


The white paint had brush marks in it and the brass was tarnished. There were a couple of chips here and there, but they had the key and it ticked. I had a new old clock.

Got the thing home and started tracing the history of that model and it's roughly a hundred years old. Since it still ticked, it hasn't seen much actual use as a clock because the bearings would have long since worn out. I wound it up and rolled the minute hand to the half hour and it chimed. So, I moved again to the hour and it announced the hour nicely. So far, so good. I had $20 invested in this thing it better pan out. I went out and got some paint remover I had left over from another project and removed some of the nasty white paint:


The grain on the wood looked OK and it appeared to be a mahogany laminate on the top of the tambour (curved part) with solid mahogany for the trim. So, I took the guts out and dug in.

Like any 'normal' person in the 21st century, I watched a dozen youtube videos on furniture refinishing and followed the ones that weren't blatant advertisements for some furniture product. I got all the paint off and it was looking pretty good:


And a huge collection of little tiny parts. These are the parts from only the door on the back where you can service the thing:


I didn't want to post the parts and pieces of the clock and chimes because that would have meant taking them out of the Ziploc bags I put them in the instant I got them loose. Losing a single little part could have been a disaster and would have certainly dropped the value of the restoration. You don't use new parts on something you're restoring if at all possible to keep it original.

Anyway, I spent several afternoons refinishing the cabinetry, another one putting the parts back in and this is what came from the effort:


I realize that tambour mantle clocks are not of great value and I wouldn't get much profit if I were to sell it on ebay, especially since shipping would cost as much as I paid for it. But that wasn't the point. Now my family holds a little piece of another families history that we can care for.

At least until the estate sale.

Another Garage Sale Find

$
0
0
I found something else at a garage sale that I'm going to write about. I promise I'll get back to technical projects for a while after this.

I was looking through a bunch of really old TV repair equipment. There was even an old B & K sweep marker generator there.


The guy had lots of old equipment. Looks like he had bought out a storage locker that was abandoned by an old TV repair shop.

This was in the days when tubes (young folk, look it up) were used. Back when we actually had tube testers to tell us if it was bad. We'd slap the side of a tube gently with a screwdriver to see if sparked. Ah, those were NOT the good old days. I didn't buy any of the electronics, they were just too old and that stuff, while magnificent in its day, just wouldn't do the job today. I don't really want to start a museum.

After spending some time prowling and remembering, I stumbled on a wine rack. It wasn't special, but he wanted $12 for it and the metal rings it had in it were more than that at the steel supply, so I bought it.

I took it home and stuck it on the counter top where I wanted it and it didn't look too good.


It was too dark for the room, and too wide for the spot. Crap, I should take a tape measure with me for things like this. Actually, that wouldn't have worked because garage sales are all impulse items or rare finds that you can't turn down. You never find the exact right thing when you're looking for it.

I guess I could sell it at my own garage sale, but I did buy it for the rings that hold the bottles. Maybe I should pursue that.

If you notice, I have unlimited space up top and a cabinet that is three rings wide would fit in the space, so I got inventive. I took the 4 x 6 arrangement


Got out my hand grinder and welder and turned it into a 3 x 8 arrangement of the rings.


I took the rings inside and sure enough, it would fit. So, then I needed a new box to hold it. I just happened to have some hickory plywood left over from my cabinets; the guy that designed them over ordered. Naturally I kept the excess because that stuff is expensive. Now was a chance to actually use some of it instead of moving it around the garage from time to time.

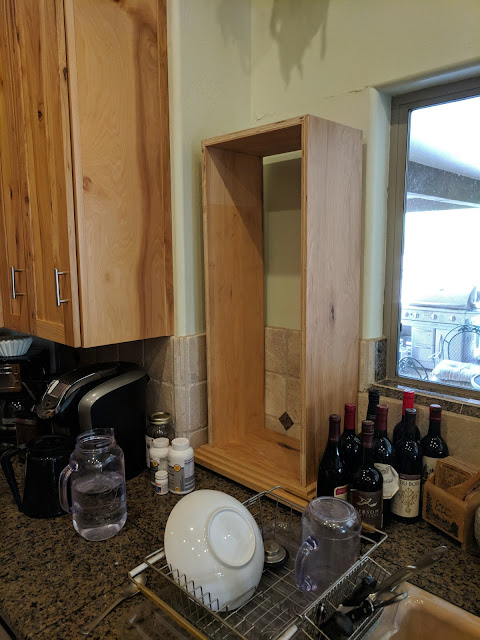
I built a basic box with no back:


then test fitted it into the same spot as before:


Yep, it was going to fit. I used crown molding for the base so it would be a little more stable and to cover up some saw marks. I had this left over also. Now, to finish it off , it was just install the metal rings. 


Add a little finish to make it shine a bit, and move it back into the house.


Now it fits the space and matches the existing cabinets. I have more room for wine bottles than I have interest in buying wine. Perfect.

Yeah, I know, I could have bought the rings off ebay and done exactly the same thing, but I never thought of that. Also, each time I visit a garage sale, I come away with more work to do.

I hope  I don't find a '32 Ford at a garage sale.

Supercooling a House in the Desert

$
0
0
A while back I ranted a while about power politics in the desert <link>, and after some thought and because I've been doing this for years now, I decided to post a few articles on 'supercooling' a house to lower power bills. Another impetus is that the latest rate increase has caused many people in my area to feel the 'heat' of the new power company rate increase.

First, what the heck is 'supercooling'?

This term came about over time because people (me!) were clobbered by power bills based on the 'demand' billing method. I first posted about this quite a while ago and even dedicated a page to it back then <link>. As I pondered and tested, I created thermostats and temperature gauges, and a lot of other stuff. This blog was actually the result of experiments and actual devices that have been copied by people all over the world to mimic some portion of my efforts.

One of the methods I tried was to cool the house way down during the off peak hours and then turn the AC off entirely during the peak period, and let the house coast through the peak period. That made my power bill the envy of all the neighbors. They weren't willing to do the same thing, but they commented on my work many times.

So, supercooling is cooling the house down a bunch before the peak period begins, turning the AC completely off during the peak and then turn it back on after the peak period ends. This is all the result of demand billing explained on the link above <convenience link>. For folk that live in the cold country, this will work the opposite way as well. You can heat it way up and then let it coast. However, I don't have any direct experience with that living here.

My early efforts resulted in great savings under what I would have been paying. So much so that solar power companies can't match me. I had inadvertently beaten the ability of solar power to save money. Here is a chart of my power usage back then:
I know, ancient charting software. But forgive me, this was in 2009 and I was new to this blogging thing.

It was very important to me that I kept the power usage to the absolute minimum during the peak period, and in those days it was from noon to 7 PM. I actually used more power this way, but paid a much smaller bill. The huge spike in power just before the peak period is me supercooling the house before I shut off the AC units entirely from noon to seven.

Basically it worked ! I was a happy puppy and decided to automate the house and take control of my power usage so I couldn't get screwed by an accident again. Thus, the adventure of the the last years began.

So, that's supercooling and my adventure into it.

Now it's time to study it some more because people want to know what to do to accomplish some of my results. Not everyone wants to tear out walls, climb up on the roof or bury wire to the septic tank. They just want to understand how to save some money.

That's quite enough background for now. Let's get to the first experiment I did.

Before the new rate increases came into effect I modified my thermostat code <link> so that the peak period was from noon until 8PM; this is a union of the new peak period 3PM to 8PM and the old, 12 noon to 7PM.  I did this so that whenever they actually implemented the rate change I wouldn't be caught by surprise and get an outrageous bill. It worked, the transition was smooth and I didn't get any bad surprises. Since it was for a very long period, it was perfect to test the heat rise inside the house; I just had to wait for a hot day.

Naturally it came with a vengence, and I was already gathering data, so first I did one set of rooms that are wide open to each other no restrictions on the air flow and are air conditioned (duh). For the test I let them cut off automatically at NOON, because I wanted enough time for good measurements. I kicked them back on at 8PM .

Here's a graph showing the set of rooms and the outside temperature. You can tell which is which. At noon, the room temperature was 76F and at 8PM the room temperature had risen to 81F for an increase of 5 degrees.  I haven't done it for only the period of 3PM to 8PM yet, because I wanted to understand the rise in temperature so I would know the settings to try first. Here's the graph:


I was surprised how little the temperature changed without AC when the outside temperature varied up to 105F. Of course your mileage will vary due to every factor known to man, things like: did you open the doors, curtains open, insulation level, ceiling fans, etc. Most everything inside and outside your house will have an impact. However, for me it means I can lower the temperature by five degrees and survive until 8PM from 3PM when the temperature is in the low hundreds. I'm sure that I'll have to drop another degree or two when it gets in the teens, but I have a place to start.

I did notice that the concrete floor was absorbing heat. It seems the sun shining on the foundation outside was travelling UNDER the insulated walls and radiating into the house. The walls in that area were cool to the touch, but that's subjective. I'll have to go around the house and check the temperature on the exposed areas to see what the floor temperature is; it may just be over-sensitive bare feet. Good excuse to buy an infra-red thermometer.

What? you want to see the power usage during the same period to see how things are going power-wise?


Notice that from noon until 8PM I use almost no power. The little rise towards the end of the period is my TV and the hump around 3:50 is me warming up some stuff in the microwave. I didn't supercool the house for this test, but I did let everything kick on normally at 8PM. That's the huge spike you see on the right.

Yes, I watch the power that closely, at least during peak periods.

One of the fallacies I see mentioned a lot is staggering appliances. This will help during the peak period by keeping the dryer from adding to the AC or something similar. That keeps the demand number lower during ONLY this period. The rest of the time (off peak) it doesn't matter at all. During those periods power is power, so go ahead, run the dryer. During peak, keep that darn thing turned off. You don't need that shirt right now, wear the least dirty one from the laundry instead.

I'll be doing more observations and experiments over the next weeks, months, whatever, and I'll try to keep links between the posts so you can follow along (if you actually care about this kind of stuff) without hearing about hydraulics, septic sensors, old tractors, wifi controls, etc.

This could get interesting and a good place for me to look when I forget why I started this mess.

Oh, this page will attract spam like crazy. Every solar service in the world will be posting something with a hidden link in their name or some word inside. There will be arguments aplenty about the costs of solar vs nothing. Off grid suggestions will probably abound. I know how to deal with this ... I delete it. So, solar sales people, don't bother, you'll just get deleted. Same for people that want to compare their solar savings, gone. Also, at some point, I'll actually have to turn off comments because I get tired of messing with the constant spam. And, I love suggestions for things to look at (if they don't cost me much).

But for now, comment away.

Previous post <link> Next post <there isn't one yet>

Supercooling a House in the Desert: part 2

$
0
0
Last post I examined how much my house's internal temperature rose over an eight hour period of temperatures that exceeded 100F with no AC at all during the period. That gives me a feel for how much I'll need to cool the house down during the peak period, but to really understand how to control things a closer examination of some other things needs to be done. First, lets look at recirculating the air inside the house between rooms.

Recirculation can be done easily by simply leaving the AC fan on and set the mode of the compressor to 'OFF'. This will move the air around the house and even out the temperature of the various rooms. Essentially you're taking cool air and displacing some warmer air in areas that might be hot spots. I tried this and found it to really works well for evening out the house.

However, I'm really frugal (aka cheap) and having both of my AC motors running all the time was too much for my personal sensibilities. I stagger them so only one is ever running, and I don't run them all the time. Here's a chart to show you what is happening.


Those little steps in there are each fan running as measured by my whole house device. It actually monitors the house's incoming power real time <link>. There's other stuff going on in the house, so the graph isn't a perfect set of steps. If you look closely, you'll notice that one of the fans pulls more power than the other; that's because one AC is a 5 ton and the other a 3, so they use different sizes of motors in the air handler.

There are thermostats that can handle recirculation for you, but they are rare. I had a couple for a while before I built my own and they worked fine. A bit hard to set up though; the manual was many pages long. My plan over time is to get rid of the thermostats entirely in favor of a computer that monitors the temperature in each room and adjusts the fans and compressor for the most comfortable environment. I'm probably a year away from that goal. Folk that don't want to bother with that can look around, there are lots of good thermostats out there.

Note that I DO NOT recirculate during the peak period. I'm just too cheap for that. Instead I use ceiling fans to move the air around in a single room and keep it feeling fresh. No, this doesn't even the entire house out, but it does well in the most used rooms. This is another of the list of personal preference items you need to consider.

Now, let's talk about the high surge current that an AC compressor uses when starting up. It's an absolute fact that most electric motors pull very high current when they first start up. When I looked at my AC compressors, they pull around 4kW when running, but the peak surge getting them started was way up around 14kW. Yes, that's nothing to laugh at; it's a lot of power.

But, it's only for a second or two. Here's a chart that shows the spikes created by starting an electric motor. In this case, it's my refrigerator, freezer and the freezer out in the garage.


I especially like this graph because I caught the garage freezer for the entire starting spike. A limitation of measuring power is that you have to capture discreet instances of power, you can't get everything. I capture it in about 1 minute intervals and often miss most of the rising spike. It's just impossible to grab everything all the time; there isn't enough storage to keep it. The reason I used the appliances is that I don't filter the readings as much. If you don't filter the reading, they're all over the place and you can't get any accuracy at all because of the inherent noise. The whole house power would be a real mess to try and read with the start up spikes from everything in the house showing up.

But back to the spike, notice how much higher it is than the run current just next to it? Here's a cutout of that particular piece all by itself.


While the normal run current is only around 100W, the starting surge is almost 900W, but also notice that it is only for less than a minute. Since the peak demand number is for an entire hour, that's not enough to impact it. The surge peaks of  electric motors is so small in actual power used that it just doesn't matter on your power bill.

There is another reason to avoid the incessant cycling of larger motors though, wear. On something like a freezer it doesn't matter much because they are fractional horsepower motors, but on an AC unit, starting and stopping a compressor is tough on the mechanics. Bearing, armatures, pulleys, etc wear out often enough, we don't want to increase the wear by 'short-cycles' on the motors. When you start it, let it run a bit if possible.

But ignore the uninformed when they speak about the huge power usage of the AC starting; it just isn't a problem. Unfortunately, many of the uninformed are AC 'experts' that we all have to listen to from time to time.

Now, since I mentioned the appliances, let me expand a bit on them. I have separate appliances for the refrigerator and freezer as well as a chest freezer in the garage. These have to run all the time to keep my food safe. I don't want to spend the money on spoiled food instead of power. I've already charted the usage of all of them above, let's look at a stacked chart of their power usage during a typical peak period. Stacking means that I add each chart line to the others so you can see the total usage of all the appliances at a glance.


I also filled the items so they would be easier to see. The fridge and garage freezer use around 100 W each and the house freezer uses about 130 W. Since they don't always run, there are actual periods where no power is used by the appliances, but not very often. The fridge runs about half the time in long periods, while the garage freezer runs in predictable periods, but still about half the time. The house freezer runs the most, partly because it has two defrost cycles a day that it has to recover from opening the door to get ice which lets the cold out. You can actually feel the cold air hit your feet when you open the door on this stand up freezer. Very convenient though.

The appliances create an almost constant draw on power that is roughly 350 watts. Combine this with ceiling fans (a necessity in the desert to keep the air moving) and the usual passive devices and my particular baseline power usage is close to 500 watts ... constantly. Everything else I run just adds to it. I don't think I can get it below that without some risk to my food supply.

It's important to note that the fridge and freezer in the house vent right into the kitchen. That takes the heat that may be inside the appliance and dumps it into the house making it necessary to remove that heat with the AC. This is good in the winter since it will keep the house warm, but not so good in the summer where you have to get rid of that heat. I may someday have to look at that as a factor, but it's a really hard thing to measure.

So, factoring all this with the appliances, the very best demand number I can possibly get is .5kW. That would actually be great, there's always something. microwave popcorn, lunch, TV, whatever makes life more fun and comfortable will creep into my power bill.

Remember, your mileage WILL vary. Your lifestyle, house, habits and the way you hold your tongue will conspire to create your own personal profile. Use this as data for decisions, not as an absolute.

Previous post on this subject <link>  Next post on this subject <there isn't one yet>

More on House Power Monitoring: Prebuilt Device

$
0
0
There's been a lot of new devices appearing on the market for monitoring power. I decided to get one and see what was actually going on. I prowled around Alibaba for a while and settled on this one:


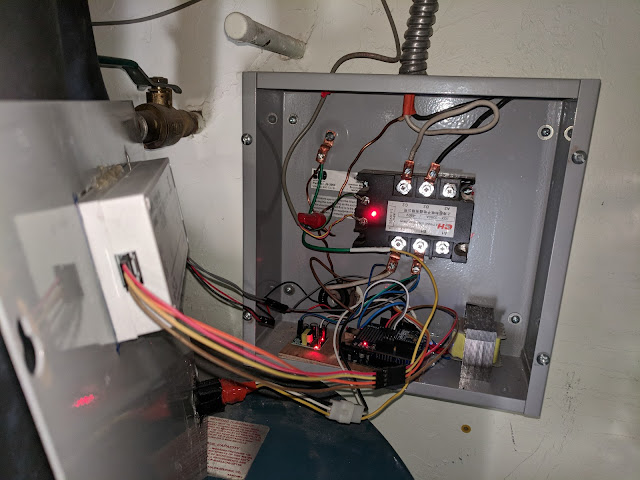
The reason I picked this one is that it has a TTL serial output that I can play with. For a long time now I've wanted a display to put on the water heater to show me when it is actually using power. This might just fit the bill as well as giving me an output that I can use to record the actual power usage. Since the water heater is 240VAC, this should do the job. If it works.

Naturally, when it came in, I took it apart to see what was inside:


The power and CT inputs are on the right and a ttl serial port is on the left. The two big chips that do the work are: Atmel 24C02N a 2 wire serial eeprom <link> and SDIC RWTS SD3004 energy monitoring chip <link>. 

These 'energy monitoring chips' are a relatively recent thing. Manufacturers took the interest in smart meters and energy monitoring seriously and produced a whole lot of special purpose chips to sell. They're pretty nice, and for an industrial application, do a good job. Every smart meter out there has something similar inside it. The problem I see with them is that for a person like me, they're too darn complicated. They take a bunch of support circuitry and need special commands to do what you want. For the time being, my own devices will use the older methods I already understand, unless this device changes my mind.

The rest of the circuitry is power supply, serial interface, support for the displays and such. I can't recommend that people get one of these because there is no clear separation between the parts that can kill you and the rest of the board. They appear to be relatively safe, but missing are the board cuts and clear indications of where the high voltages run. For a beginner that wants to start monitoring devices, this could get them in trouble.

But, trouble seems to be my middle name.

My water heater is solar. I have a panel on the roof of the garage that heats water, and when the temperature in the heater is less than the temperature of the solar heater, it pumps water from the panel to a heat exchanger inside the water heater. The heat exchanger is necessary because the fluid used in the panel is partly ethelyene glycol to avoid the possibility of freezing up there on the roof. The heater tank is 80 gallons to hold enough hot water for a long time. There is a little 45W motor that moves the water around to do the heat exchange.

Additionally, there is a helper element inside the hot water tank. The helper element is activated whenever the water needs heating, including when the sun is out and the solar is working. They recommend that people put a timer on the helper element, instead I hooked it into the house controls <link>. So this device gives me the ability to use the serial output from the power monitor to record the energy used by the heating element of the water heater.

But, why is that important to me since I have a solar water heater. Firstly, because I can. Secondly, it would be good information to know what a water heater actually uses in energy for my purposes. Heating a bunch of water is an efficient task since the element is actually submerged in there, but it still uses a heck of a lot of power. I want to understand this.

The very first thing I encountered was hooking the darn thing up in some kind of test bed. I really didn't want a bunch of jumpers carrying 220 hanging off my water heater, so I cut up an old extension cord and built a test bed for a 110VAC light that had two bulbs. That way I could change the bulbs and see different values as a kind of calibration test. I made darn sure the wires weren't exposed so I wouldn't rest my arm on them. The meter worked fine and actually gave a reasonable reading first try.

Next I went looking for how to hook up the serial port to my laptop. The USB to ttl serial cable that came with it had a fake chip in it and wouldn't work. I chased down the correct drivers for the chip and got the serial working, but couldn't find the proper baud rate anywhere in the (slim) documentation that came with it. That got me to searching the web for information.

Really fortuitous problem. There are a lot of sites out there that have messed with this device and put up examples. I even ran across a library to support it in github <link> so I wouldn't have to do everything from scratch. By the way, the baud rate is 9600!

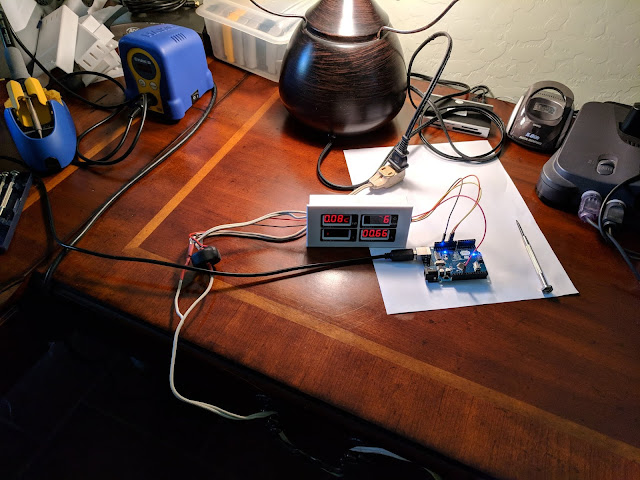
So, I added a little arduino to my test setup and started to peck away.


Yes, I know it's not the safest setup in the world, but as long as I remember to pull the plug before grabbing that metal screwdriver, I should be OK.

As you can see, the monitor worked first try and all the displays worked. The picture missing some things is an artifact of the pulsed display. I didn't have as much luck with the software I found though. It took me a bit to figure out what 'yield();' was that was keeping me from compiling, but it turns out that that is simply a delay(0) for the esp8266. I added a stub for that.

Everything worked from then on Here's the serial results as it came out of the box:


The power, voltage and stuff was right on the money when I compared it to other devices I have around the house. The current transformer they supply is one of those that you have to remove the wires to use. You can see it in the picture above. In some places you can't get the wire loose for various reasons, so I tried a SCT-013 that can be found all over the place and I happened to have. The results were not as pleasant:


If I need to use one of those, I'll have to hunt down and change the burden resistor since I can't get to the calibration. The displays shows one bulb at first and two about half way down; roughly half what it should be. There are no markings on the supplied CT, but I bet it has twice the windings of the SCT-013.

So, now I'm at a decision point. Do I add this to the water heater setup or not? If I do, do I use a separate system from the garage device. The garage is currently handled by an Arduino that controls the water heater and the garage doors. This device could be for the water heater like I have one for the freezer and such.

Decisions, decisions.

Supercooling a House in the Desert: part 3

$
0
0
I'm going to talk about the APS (Arizona Public Service) phone software for monitoring your power. For folk that don't live here (Arizona, USA), much of this will be of little value. It might give you a clue as to how your own power company works, but this is directed at my neighbors.

I'm not going to describe how to look at your bill, or make a payment, etc. I want to talk about the usage numbers and graphs they provide so you can monitor how good or bad you're doing at saving money by juggling power usage.

First though, I want to explain a bit for people in other countries with different rules around providing power. The name, Arizona Public Service is historic and not actually reflective of what it is. APS is a private company that supplies power to a big part of Arizona. They are publicly held (as in stockholders) and regulated under Arizona's version of a public utilities commission, the Arizona Corporate Commission (AZCC). The AZCC is also in charge of licensing corporations in this state. So, if APS wants to increase its rates to customers, it has to get approval from the AZCC. Confused yet?

One of the things that is part of every submission for a rate increase is the statement, "fair and reasonable return on investment." Which means that if APS runs their business sloppily and doesn't make enough profit, they ask for a rate increase to increase the profit. Nice business to be in. If you screw up a business decision, there's someone out there that will guarantee you a profit.

No, I'm not being completely fair, there are various government requirements that APS is forced to meet, and those do increase their costs. But, every time one of those comes along, a new 'fee' is added to our bill. AZCC approval of these items is almost automatic.

Enough background, on to the actual application.

The app is called 'APS' and is on the google play store for download. Once you get it installed, you can log in to your web account with APS and look at billing and usage. There's also hints on ways to save, but that's just the usual things that we see every day about conservation. The last choice is 'apsFYI' that is the same things that they send with the bills. I'm not going to discuss the billing areas; it's hard to remove my account information from every single illustration. I may get to that at a later point though.

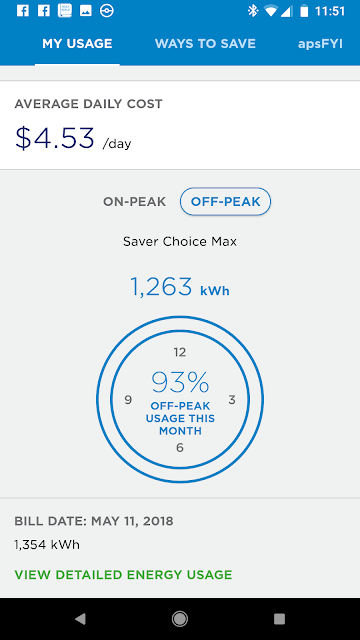
Lets go to 'MY USAGE' and see what it shows for me when I do it, that's where the fun stuff is:


You get a nice display that shows your percentage of use on peak. That means of the amount of energy you used so far this billing period, some percentage was during the peak demand period. Mine was 7%, which must mean that the rest, 93% was off peak usage:


And they have a display for that as well. The real data that can actually help is found by touching the 'Detailed Energy Usage' link at the bottom.


This is actually a nice chart that shows my energy usage for the last 6 days. It's only been six days so far this period. The bars are divided into peak usage, green and off peak usage, blue. The height of the entire bar is my total usage for that particular day. So, I used a lot off peak and only a little bit on peak; the actual values for these can be displayed by touching one of the bars.


So, what does this mean? It shows you when you are using the most power, on peak or off peak, and that's important because the billing rates are considerably different. I want to use as little as possible on peak and concentrate my usage to the off peak periods. That way I can use the larger appliances and pay the least possible for it.

If you touch 'LAST CYCLE' you'll be shown the entire period and you can inspect each day to see if you ran something big during the peak period.


This display can be scrolled left and right to get to a particular day. You can then see the days where you used the most power and work out a plan to deal with it in some fashion. Notice that I used almost 80Kwh on the 28th; it was Saturday and off peak, so I just let the AC run. Rates are much cheaper off peak and I can afford to do this. You certainly wouldn't want the green area to get large because that would result in probably an excess of $100 addition to the bill.

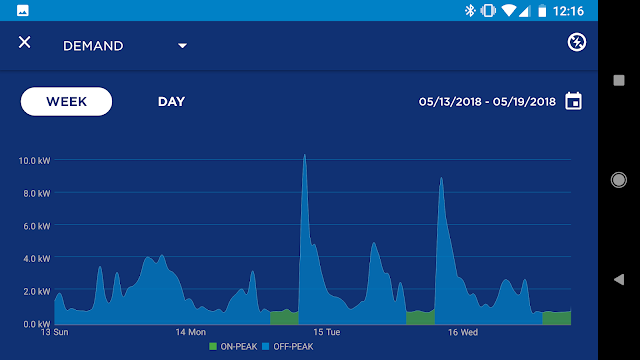
Up at the top of the display is a drop down menu currently labeled 'Daily Energy Use', This menu will let you look at a more detailed display that will actually show you your usage times. Here's mine:


For the last week this displays my usage on a time line so I can get an idea when my major usage occurs. My chart above shows that I cut the usage way back during the peak period (green) and then let it run wild the rest of the time. The big peaks just after the demand period is the AC kicking on full bore to cool the house back down to where I normally keep it. Also in there is the stove, dryer, pool pump, all the things that use a lot of power. See how I control my usage to only the cheaper times?

The reason they call this 'Demand' is because you can scan the green area to see when something turned on a drove the demand number up. They save the highest of the green parts as your demand number and use it as a multiplier on your bill.

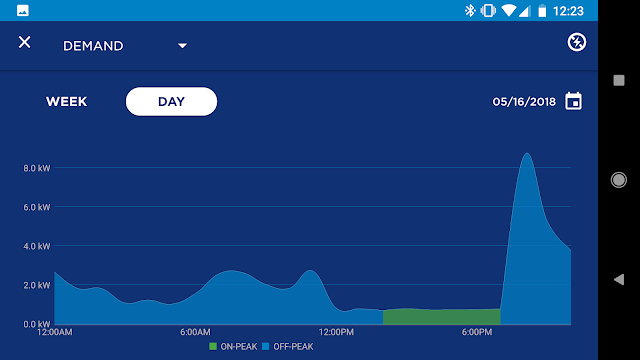
If you choose 'Day' up near the top, you can get one days usage and a good indication of the time of day that you used a lot of power.


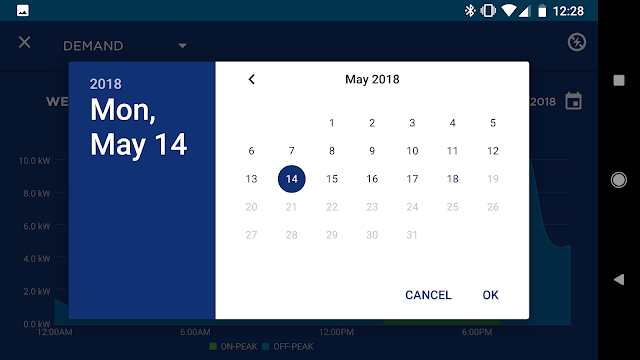
My big power usage spike came after the peak period (green), so I paid the lowest price for it. Notice how I keep the green area (peak usage) as low as possible? That keeps my demand number down to save money. You can get to a specific day by using the little calendar symbol on the upper right.


Doing this will allow you to zero in on some usage period that may be giving you trouble. Fridays after work when you're hot and kick the AC on too early, or the day the kids were home and fooling with the thermostat come to mind. Little things like that can mess up the demand number and cause an unexpected large bill.

That's pretty much the guided tour of the APS app. It can tell you how well you did at controlling usage and help isolate troublesome events. What it doesn't tell you is how you are doing right now. You can't get the current day, or a close to real-time display to tell you something is on that shouldn't be. You can only look back.

My contention is that this nice display was designed to help the APS representative prove it was your fault you get a large unexpected bill. However, given enough time, you can use it to learn what hurts and what you can get away with; you just have to pay for the mistakes when they happen.

Previous post on this subject <link>  Next post on this subject <there isn't one yet>

PZEM-004: Now to actually use it for something

$
0
0
Literally hundreds of these energy monitors have been sold, but judging from the various articles I've run across, not too many of them have actually been used to meaningfully monitor power around the house. I'm going to install one of them on a troublesome device and actually use it to help understand my power usage. My current victim is my hot water heater.

I've described it before <link>, it's a solar hot water heater with a helper element in it for times when the sun isn't shining. Basically every day here in the desert I'm supplied with unlimited heating for water, but how often do I need the heater element? The element is designed to turn on any time the temperature drops below a certain temperature, but I have no idea what temperature that is. I have the solar heating set for 138F, and since it is an 80 gallon heater, this supplies my needs quite well. Nevertheless, I still want to understand the device and how it uses power.

The first thing I need to do is both read the serial output from the power monitor and be able to transmit it to my house controller so I can save the readings over time. This turned out to be a problem because an arduino only has one hardware serial port. It is possible using software to get another one, but having two software ports is a problem.

The SoftwareSerial library allows for two serial ports, but you can only work with one at a time. Each time you switch ports, the input buffer for the other one is cleared. When I tried it, that meant that the buffers were wiped such that I couldn't actually get enough data from either the XBee or the power monitor to construct a usable packet. I want the serial port for debugging and commands, so I had to work out another method.

What I did was set up a timer that fires off every 15 seconds to interrogate the power monitor, saving the data in global variables. Every 30 seconds another timer fires and sends a report of whatever the variables happen to hold at that time over the XBee network. This way I have reasonably fresh data to send every thirty seconds and only use the two software ports one at a time.

The exception is that in the main loop of the code I check for incoming data from the XBee network at every iteration. Basically in the idle periods between gathering and reporting, I check the network. To prevent the arduino startup from sending bad data from the variables that aren't filled in yet, I read the power monitor before I do anything else. Then I wait for a time message from my house clock, set the two timers and let it run.

It seemed to work pretty well.

Now, how the heck am I going to attach this mess to the water heater? I'm dealing with mains voltages here, I can't just stuff it in a cardboard box and hang it by its USB cord on a nail. This will take some consideration. Additionally, since there is no neutral line to the water heater, everything needs to work from a 220VAC source. Yes, I know, most of the world already has this to deal with; for me, it's a new experience.

Being impatient, I took a big rag and insulated (if you can call it that) the top of the water heater and hooked the power monitor to the high power solid state relay that I use to control the power to the water heater. Then I draped the USB cord over to a wall plug for 5VDC power to the arduino and XBee combination. This way I could actually watch the water heater power usage real time and work on the software to add the data to my Graphana display.


I had some foresight though, I put in plugs for the connections to the CT, 240VAC voltage monitor and serial input so I wouldn't have to flip the breaker when I did something, and it worked like a charm after some programming to save the data I had gathered and a little work in the charting software:


Granted, it's not much to look at. The heater only turned on three times, and even then, it was only for a minute. Slow day around here, but notice that the spikes are 4500 watts. This thing can really pull the power; remember, the solar is running also.

What is happening is that using hot water causes the temperature in the tank to drop and both the solar and the helper element kick on. This heated the water back up in a hurry. Or, maybe I have a bug I haven't discovered yet. Over the next few days I intend to look at how hot water is used for showers and general use around the house. I won't get good data on how this thing is working until I can also monitor the small solar pump as well, but that will take some thought, and probably, some more parts and pieces. Keep in mind that the small pump is 120VAC and I'm working with 240 at this point. A transformer maybe??

My data gathering will be impacted by the fact that the water here doesn't get cold enough to need much of it. This time of year, the rest of summer and early fall, one can take a shower with nothing but the cold water turned on. The best we get for cold water is tepid, and maybe use a tiny bit of water from the hot side. Not that way in the winter though, then hot water usage is much higher.

I'm starting to like the PZEM-004; when this project is running, I want to look around at other similar devices. It's hard to beat less than $15 for a device like this. I certainly can't build an equivalent for less.

I'll put the code for this on github when it is a little farther along. There may be too many bugs right now.

Previous post on PZEM-004 <link>

Ordering Chinese Devices Through Amazon

$
0
0
This isn't a complaint session about Amazon, they've done well by me <link> several times, nor am I going to complain about Chinese products; a lot of the posts on this blog are about those items. This is just the story about a single product that I thought my readers would enjoy.

I needed a 240VAC to 110VAC transformer to provide power for my latest project, increased monitoring of my solar water heater. The 45 watt pump that moves fluid from the rooftop collector actually measured 68 watts when I plugged it into a Kill-a-watt to measure it. I know how this stuff goes, so I figured I'd probably need a 200 watt transformer because they always over rate these things in the specs, and I should probably stay below 50% of rating to get good service.

Have you checked out the prices on those things? A simple 2 to 1 transformer can cost as much as one can pay. The prices I found started around $37 and went up indefinitely from there. I know these things exist and shouldn't cost as much as some televisions, so I looked for another solution. I thought I found it and ordered one of these:

It's a 220 to 110 transformer rated at 200 watts for converting power for US travelers abroad. The images on Amazon showed the interior and it is a simple transformer with no other supporting circuitry to worry about. This should be perfect and only costs $16. That's less than half the price I found for the transformer inside.

It came in today and I rushed to unwrap it --- it rattled. There was something broken inside that sounded like a piece of plastic. But first, here's a picture of what I received:


First, notice the plug. It's a normal non-polarized US plug, not the European round pin plug shown on the Amazon page. Why would they put a US plug on something that was designed to be used outside the US?

Since I was going to dismantle it anyway, I took it apart.


There was the transformer I needed, but what had happened was that the transformer had come loose from the case, banged into the molded socket and broken one of the plastic pieces. The transformer was supposed to be mounted with some of that high strength two sided tape. I've used this tape several times and it really works great; why did it fail? Well, here's a shot of the tape:


Don't see it? They didn't remove the paper from one side of the tape. Like all two sided tape rolls, there is a piece of paper on one side of the tape. You cut off a piece, stick it to whatever you're attaching, then peel the piece of paper off and adhere the tape where you want it. This simple technique holds lots of things in our everyday life in place. The decorative molding on your car is probably held on this way, and you drive it at speed down the road every day. This stuff is good, if you actually remember to take the paper off.

What happened is that Amazon took the converter off the shelf in its box, shoved it into a padded envelope and shipped it to me. One of the conveyor belts somewhere dropped the envelope a little ways, the  loose transformer banged against the molded socket and broke it. That was how my rattle came to be.

If I wasn't going to only use the transformer, I would have returned it for another one. But the part I needed came through the ordeal unscathed. Unfortunately, there are no numbers on the transformer at all. No manufacturer, no nothing that can help me trace it to buy another. Maybe someone reading this will have some idea where I can source another when I need it.

So, even though the plug is dumb, it arrived broken and would have been intrinsically unsafe in use, it fits my needs perfectly. I saved at least $15 buying this instead of a transformer from a regular supplier.

Go figure.

Monitoring Water Heater Power

$
0
0
Well, I can now monitor my hot water heater power usage. The step-down transformer I got <link> worked just fine and I managed to put together all the pieces and now have it out there running just fine. I mounted the transformer on the lower right of the picture below. I used exactly the same technique that was used in the power converter it came out of, high adhesion two sided tape.

What I did was to spread some silicon grease on the bottom of the transformer then put the tape on one side. I pressed the grease down on the enclosure and slid the transformer back until the tape adhered to the back of the enclosure. This way I used the entire steel enclosure as a heat sink for the transformer. I used the same idea for the three phase solid state relay (SSR) that actually controls the power to the water heater.


In case some of you haven't worked with power transformers, they get hot. It seems like no matter how high the rating, they generate more heat than expected, and can cause problems over time. That's why I was careful about giving the heat generated somewhere to go.

Just to the left of the transformer is an Arduino with an XBee shield on top, and just left of that is a AC to 5VDC switching power supply.

This little power supply is really nice:
I got it from itead.com a while back because I knew I would need a small power supply in the future and wanted to try one out. Unfortunately, they retired this model and I only have one left. I guess I'll have to hunt down another one sometime in the future.

I took the easy way out in mounting both the Arduino and the power supply, hot glue. It just wasn't worth the effort to build something special to hold them in place, so I grabbed a piece of plywood and mounted them to it. Worked fine, and they'll still be easy to get to if I want to change something or fix it in the future.

The enclosure is from Home Depot and I've had it for a while now. It's been the enclosure for the big SSR in the middle of the box for years, I'm just now adding more circuitry to it.

I'm interested in monitoring the power right now, so I haven't moved the code to control the SSR over to this Arduino yet, but that will come in a few days. That control is still part of my garage controller that also controls the garage doors. As a matter of fact I had power applied to the water heater when I took this picture; you can tell because the LED on the SSR is on. The control for that comes through the small wire on the top and connects to the left side of the SSR.

I was a bit worried about how far the little XBee would reach since it would be inside a grounded metal box once I put the lid on, but it worked well enough that it got to another XBee and the network took care of the store forward part I needed to get away with this.

It looks pretty good up there on the wall above the water heater:


Now I can glance up at the display and tell immediately if the solar pump is working, the mains power is being used or nothing is going on. To measure the power used by the solar pump and temperature controller I used the transformer mentioned above to reduce the power from 240 to 120 and put a plug on the front of the enclosure.


Notice that the solar pump is running when I took the picture. It uses about 80 watts to circulate the fluid from the collector on the roof through the heat exchanger inside the water heater. It has to run a long time to heat the water up inside, but at 80 watts, I don't even notice the power usage.

Now that I can see all the power data for the water heater, I can pretty much write it off as a large factor in my power bill.


Above is a chart of the last 24 hours of all the power usage by my solar water heater. Notice that there is one peak of main usage around 10AM and some light usage at other times. The large peak is too short in duration to cause a problem with the 'demand' billing and the light usage is around 80 watts from the solar pump.

Here's a chart of just the solar pump running:


The gap just to the left of middle is me installing stuff. Yes, I turned off the breaker; I have a healthy respect for 240VAC directly from the mains panel. All the jagged readings on the lines are the circuitry doing measurements and sending them off through the XBee. I have blinking lights on the Arduino and displays of the PZEM-0400 that are constantly changing. Makes for an interesting display.

Now before the more astute readers out there start picking on me for parasitic power usage, here's a chart of the power usage when nothing is heating at all:


The usage when nothing is heating varies between 3 and 10 watts, that will take a long time to add up to a full kilowatt and even show up on my bill. If you look up above at the first chart, you'll see that this is the condition that the water heater is in most of the time.

Actually, when I looked at parasitic power a few years ago, it just wasn't a problem. I have a baseline of roughly 500 watts that is used all the time. Things like ceiling fans, necessary appliances, phone chargers and such do add up, but what are you going to do about it? You have to keep the food cold and a 10 watt device running just isn't worth bothering with. All the hype about this just doesn't add up.

So, I did all this just to find out that my water heater is doing a really good job of saving me money. To heat the 80 gallons of water in my heater using the rule of thumb number of 0.166 kWh per gallon (60 degree F increase) for 80 gallons is 13kWh of power. I get it for a few hours of 80 watts in full sun. And, sunny days are not something in short supply around here.

I'll use the charts and power control to find a happy medium between using sunshine and mains power for keeping the power bill under control. I'm sure I can fine tune this over time. Plus, for the rare cloudy day, I can always crank on the power during off-peak periods to handle my hot water needs. I have special web code to do that from anywhere <link>.

I'm not quite done with the water heater yet though. I want to put a couple of thermometers up against the tank one at the top and one at the bottom to measure the actual temperature of the water. I also want to move the code that controls the SSR over to the new device so I have all the water heater code in one place.

But this little exercise has opened the doors to another possibility. All of my 240 volt appliances should have monitoring like this. I can get several of the power monitors and install them for the AC compressors, AC air handlers, dryer, and maybe even the microwave. Heck, I could monitor the kitchen oven as well. Hmmm, I could use another SSR and keep the darn clothes dryer from messing with my power bill, that has happened twice now. Someone needs clothes dried and they turn on the dryer during the peak period. I can actually put a stop to that by doing what I've done with the water heater.

How come every project leads to another?

Wrapping Up The Water Heater Monitor (and control)

$
0
0
For the present, I'm going to claim that (as the British say) the water heater monitor is, "All done and dusted." There's a few tiny items I'll mention that I may do in the future to make is a little easier for other folk to understand, but it does what I set out to do with it.

It monitors the temperature at the top and bottom of the tank, the power usage of the entire system and controls the power applied to the internal heating element. I save the data on my house data base and can chart anything I want. It has been a cool project that I got to use new things on and implement some software that I haven't dealt with yet.

To measure the temperature I made a couple of sensors out of discrete 18B20 temperature sensors and installed them under the insulation against the tank at the top and bottom. No, I wasn't going to drill into the tank to install them, and I wasn't going to tap into the existing sensors that drive the tank. Tapping into the existing sensors might break them and drilling into the tank would have been a disaster. I want this thing to be capable of working if the new electronics ever fail.

Here's one of the sensors:


I thought about using one of the 18B20 sensors that are enclosed in a waterproof stainless steel enclosure, but I wanted as much sensitivity as possible and jamming the sensor up against the tank and securing it with metal tape seemed like the best way to do it.  It was a bit of a pain getting through the insulation to the tank, and the tank itself was covered with a high density insulation as well. I didn't dig into the tank coating; I just secured the sensor to the top of it. This made my reading low as compared to the temperature of the water inside, but if necessary in the future, I can correct for that by adding a little to the reading in the code.

With two sensors, the PZEM-004 power monitor, power supply and control wire for 220VAC power to the heating element, I ran into a little problem with available connectors for power ground and the sensors. After considering electrical tape, hot glue, shrink tubing and such, I just soldered some more power, ground and sensor connectors on the XBee shield I used.


Those three vertical black things are where I tap off and supply the various power and signals. I'm going to have to remember this trick in the future. It turned out to be a really convenient way to get extra connections. I even put the pull up resistor that one-wire devices need in there. You can barely see the 4.7K resistor in there between the rows of connections.

But, you ask, what did you discover after all this work? Well, I discovered how annoying working on a step stool over the top of a working solar hot water system is. Up, down, dropping things, wires too short to reach, taking it apart, putting it back together, all were inconvenient. It probably added several hours of pure frustration to the process, but all of us folk that do this around the house should be used to that ... right?

Here's a chart of actual operation that I pulled today:


In this the solar is running at around 80 watts and then reaches temperature and shuts off. The top of the tank was at 129F and the bottom at 118F for a differential of 11 degrees over the height of the tank. The actual water temperature measured at a nearby faucet was 138F, so it looks like the tank coating was keeping 9F of temperature away. To me, that's OK since I understand what is going on.

I also caught this where I turned on the dishwasher after the sun went down:


You can clearly see where I turned on the dishwasher and the cold (well tepid) water came into the bottom of the tank. Then a little later the rinse cycles of the dishwasher removed some more hot water from the tank. The temperature at the top of the tank didn't drop that much though, only down to 127F. It wasn't even enough to turn on the heating element (it was dark outside). Here's the entire chart for the same period:


Ok, it's a mess. That's because the power being used is only 3-10 watts and that auto expands to cover most of the chart. But, you can see that it isn't using 80 watts circulating the solar or over 4000 watts running the heating element, and that the grid power was available by the green line at the bottom.

That means that I ran the dishwasher a full cycle with hot water and didn't pay anything for heating the water since it was still hot from the solar cycle during the day. I've seen this several times now; the dishwasher, shower, various faucets, don't use enough to cause the heating element to turn on. Especially since the incoming water is probably close to 100F already during the day.  Hang on a minute, I'll go measure the water temperature coming into the house right now.

It was 89.6F. So, the incoming water is 90F and the solar will take it up to 138 making the differential only 48 degrees or so. It will show up as 129 on the graph due to the loss I described above, but that's a known thing. As a matter of fact, the heating element hasn't come on at all in the last 72 hours. I can't show you a graph to prove it because I've had the thing taken apart too many times. I may post an update later after a few days of operation. But, as a consolation, let's take a look at the cooling rate of the water heater:


Here is a period between cycles of the solar heat running. The bottom temperature is affected by the solar running, so it is higher than the incoming water temperature; the heat transfer coils are at the bottom. That makes the bottom temperature drop at the beginning. The top temperature  drifts down over time at a reasonable rate of about a degree every hour that decreases to less than a degree every two hours when it gets around 125F or so. This thing will keep 80 gallons of hot water all night this time of year. I'll have to wait a few months to see what it does in colder weather. If it gets too cold, the heating element will turn on and raise it back up anyway.

Which brings up a point I didn't realize until I did this. The temperature for solar heated water is 138 degrees. I set that back when I got the heater and it is controlled by a differential controller separate from all the other stuff. The electrical heater is set lower; how much lower I don't know yet. I'll experiment a bit to find out, but I suspect it's about 10 degrees or so. That's why the mains power isn't used much. The solar keeps the water above the temperature where the heating element kicks in. I don't know where that control is, but it's worth looking for at some point.

Software wise, it wasn't particularly hard to put together. I used the arduino library for one-wire sensors like I did for my room temperature sensor project. What I did was to read the sensors, then read the power, then send the data using timers. Since the water isn't changing very fast due to the nature of water and the mass of 80 gallons, I only read it every minute. I read the power every 15 seconds. The report is sent every 30 seconds right now, but that may change in the future when the new wears off the project. In the remaining CPU cycles, I watch the XBee for incoming items.

I only respond to the time signal and a command to turn on the mains power. The mains power was easy, I just picked a digital pin on the arduino and set it high to turn on the 100 amp solid state relay in the box. I watch the time for obvious reasons, I turn off the mains power at noon (soon to be 3 PM) to avoid the peak period charges. It doesn't get to turn back on until 8PM.

I used the timeAlarm library for the arduino to handle both timers and alarms. Timers control the readings and report while alarms turn the mains power on and off.

See how previous projects where I used time and various libraries are paying off? As one works with this stuff it gets easier to put things together and create something new.

It didn't work first try though. Most of it did, but the darn thing quit sending data every day at noon when it turned off the mains power to the heater. The problem turned out to be that 'on' has one less letter than 'off', and I was overflowing the buffer that I build the JSON report string in. That simple little problem took almost a day to isolate. I kept trying to blame it on the pin controlling the SSR.

There you are, the most comprehensive water heater controller I've ever seen. Probably more than I'll ever actually need.

But, exactly what I wanted.

Edit: I just put the code in Github so you can take a look if you want to.

Supercooling in the Desert: May 22, 2018 a day that will live in infamy !

$
0
0
This is the day I got clobbered by APS (my power company)


Look just before 8PM (20:00); see that bunch of spikes? My peak billing period lasts until 8, and something was sucking power before the period ended ! Let me expand the little piece that shows the problem:


That little period from about 7:24 to 8:00PM was the clothes dryer.

Yes, just a little before the end of my peak period a guest started the dryer to do some clothes. It wasn't their fault, they didn't know that the fascist power company would be watching to see if such a thing happened.

The peaks run as high as 7.4 kW, and it was doing this for a little over a half hour. The APS chart shows it like this:


And it was almost impossible to find. I looked for quite a while before I noticed it. I put the arrow on there to show you the tiny little green area that resulted. It shows up a little better on a single day chart:


That minor little slope up in the green area is where the meter saw the dryer running. It's recorded as "usage 3.18" during the 7-8PM hour. In theory, this should be my high 'demand' number that is calculated into my bill for the month.

I guess I should do a little calculating to see how this works to help me understand and avoid it even more stringently in the future. Let's look at the detail portion of my bill first:


So, the demand number wound up being 3.17 and is used as a multiplier in several items in billing. Here's the rate sheet for the plan I'm on:


So, my 'On-Peak Demand Charge' is 17.438 * 3.17 for $55.28. But, there's nothing on my bill that says that. Guess what? To make it more complicated and harder to understand, they actually split the $17 charge into two components and calculate them separately. From their tarif sheet again:


Notice how the two numbers, $4.000 and $13.438 add up to the $17.438 they call the 'On-Peak Demand Charge'. OK, fine, I have a calculator and can punch in numbers like anyone else. 4.000 * 3.17 = 12.68 and 13.438 * 3.17 = 42.60, and they add up to the 55.28 I got above. So I should see:

Delivery On-Peak Charge 12.68
Generation On-Peak Charge 42.60

Or something similar on the bill, and indeed I do. Sort of:

Demand charge on-peak - delivery $12.40
Demand charge on-peak - generation $41.66

If you look at the bill, you'll see them on there. The sum of the two charges is $54.06 which is darn close to my initial $55.28. The reason for the difference is that APS made a mistake in the original rate change request and has to use the demand number to one significant digit and they can't round, so the actual demand number they get to use in this case is 3.1kW. That's on the bill also, so I don't even have to do the truncation itself:

Your billed on-peak demand in kW 3.1

That's a good thing because rounding would have put me up to 3.2 and would be paying even more.

Now, I got the cost all figured out, the dryer running cost me some amount, but how much extra based on past performance. To get that, I'm going to look at last month to see; taken from last month's bill:

Your billed on-peak demand in kW 1.5
Demand charge on-peak - delivery $6.00
Demand charge on-peak - generation $20.16

That stuff totals up to $26.16, so my dryer cost me $27.90 last month because I didn't keep it under control. It's actually a little bit higher because the rate per kW during peak is higher ($0.08683 vs $0.05230), but that's only 3 cents per kw, and the dryer only uses 7.5 kW at around a 50% duty cycle for 3.75 kW or $0.32 extra. I'm willing to ignore that.

Now is the appropriate time to talk about how APS gets that demand number. As I mentioned in another post, they average each hour and compare it to the maximum hour during the billing cycle. That gives me 5 vulnerable periods each day: 3-4, 4-5, 5-6, 6-7, 7-8. So, the dryer kicked on and sucked power in bursts like all electrical heating appliances and those bursts pulled 7.5 kW for a short period. The bursts were roughly half the time, so it worked out, on average, to the 3.17 kW number that APS measured. It would be too much to read if I did all the calculations, but you see what I mean. That 3.17 was the highest reading so far that month, so it kept it and continued to look for a higher hour; fortunately, it didn't find one, and that's how the month's bill came to be. Next post I'm going into how to read our smart meter so folk can actually see what is coming. Unless one goes to the trouble of doing what I've done, you can't catch it real time and stop it; you can only see the what's already happened.

This is not going to break me, but it does lose me some bragging rights. Because I didn't keep control, I'm out about 28 bucks. Be warned though, if the hot water heater had kicked on, and the stove was running, this would have been a monetary disaster. Thank goodness it was only the clothes dryer and that close to the end of peak !

There you are, an example of how power can get out of control no matter what you do and how much attention you pay to it. Something will slip in and get you from time to time. Overall though, keeping tabs on my power has saved me thousands over the years. This post is also good for folk that don't completely understand how that 'Demand Billing' stuff actually works, and how to tell if you're messing up.

The parts to prevent this from happening to me again are already on order.
Viewing all 218 articles
Browse latest View live